Cardiac Viability
|
Purpose
|
Cardiac Viability MR is performed for functional analysis and flow quantification and evaluation of viable and scarred myocardium.
|
Relevant anatomy and imaging planes
|
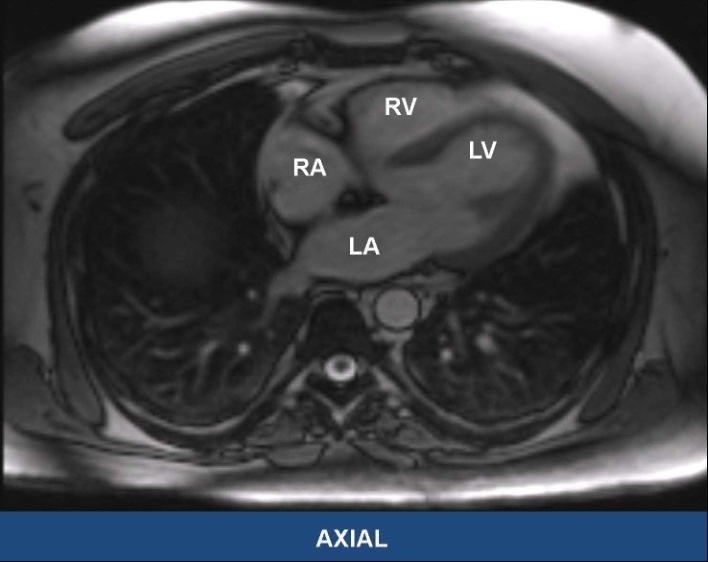
Axial |
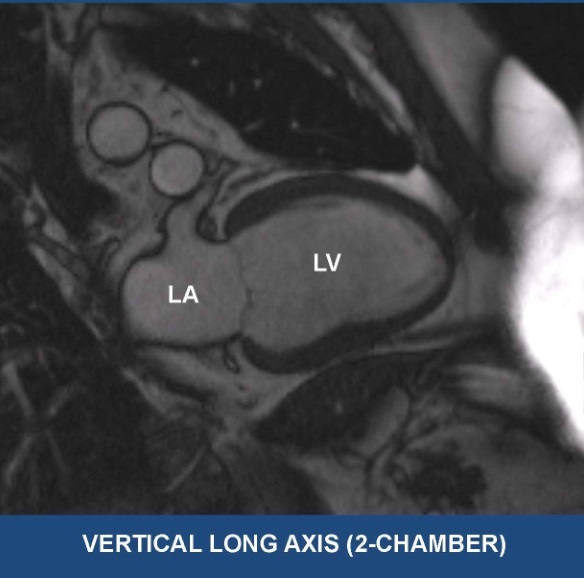
Vertical long axis (VLA, 2 Chamber) |
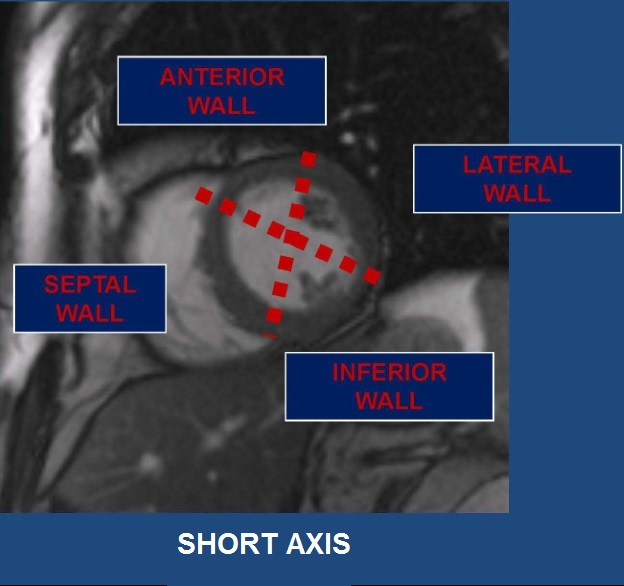
Short axis (SA) |
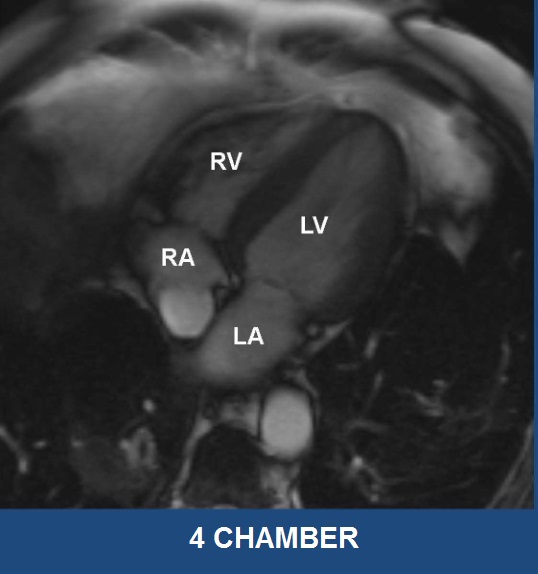
Four chamber (Horizontal long axis, HLA) |
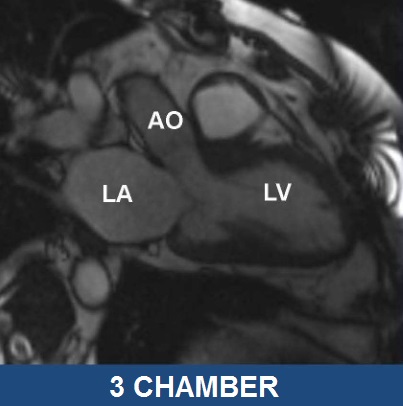
3 chamber (left ventricular outflow tract, LVOT) |
Images courtesy of Dr. Stefan Zimmerman
|
Common sequences
|
Scout localizer images:
|
3 planes, 5 images. FLASH (spoiled GRE)
|
Bright Blood Axial
|
Bright blood sequences are typically gradient echo (shorter acquisition times, more susceptible to artifact)
|
Bright Blood Cine
|
- Balanced steady state free precession.
- Gradient Echo sequence, which is very dependent on the homogeneity of the magnetic field.
- Fast acquisition with high signal to noise ratio.
- ECG-gated sequence with one slice acquired per breath hold.
- Acquired in multiple planes for evaluation of cardiac wall motion:
- HLA
- SA
- Cine short axis images are used for quantification in post-processing
- VLA
|
Dark Blood
|
- Dark blood sequences are typically spin echo (longer acquisition times)
- Double Inversion to null blood
- Triple inversion would also null fat
- High resolution, provides morphologic information
|
Perfusion and Delayed Enhancement
|
- Double dose of contrast is used in cardiac imaging, as patient's GFR allows
- Inversion recovery is used to null normal myocardium
- To determine appropriate TI (inversion time, which is typically ~175-330 ms), a TI Scout series is obtained
- Gadolinium washes out slowly from areas of abnormal myocardium
- Phase Sensitive Inversion Recovery (PSIR): Automated sequence that does not require a TI scout to null myocardium
|
Phase Contrast Imaging
|
- Velocity encoded gradient echo imaging can be used to quantify moving blood
- Measures phase shift of protons, which gives information about direction and velocity of flow
- Plane selected perpendicular to path of blood flow
- VENC (cm/sec) selected based on expected velocity (want slightly above)
- Aliasing will occur when peak velocity is above VENC
- Can be used to calculate shunts (e.g. Qp/Qs), stenoses, and regurgitation
|
|
Post processing
|
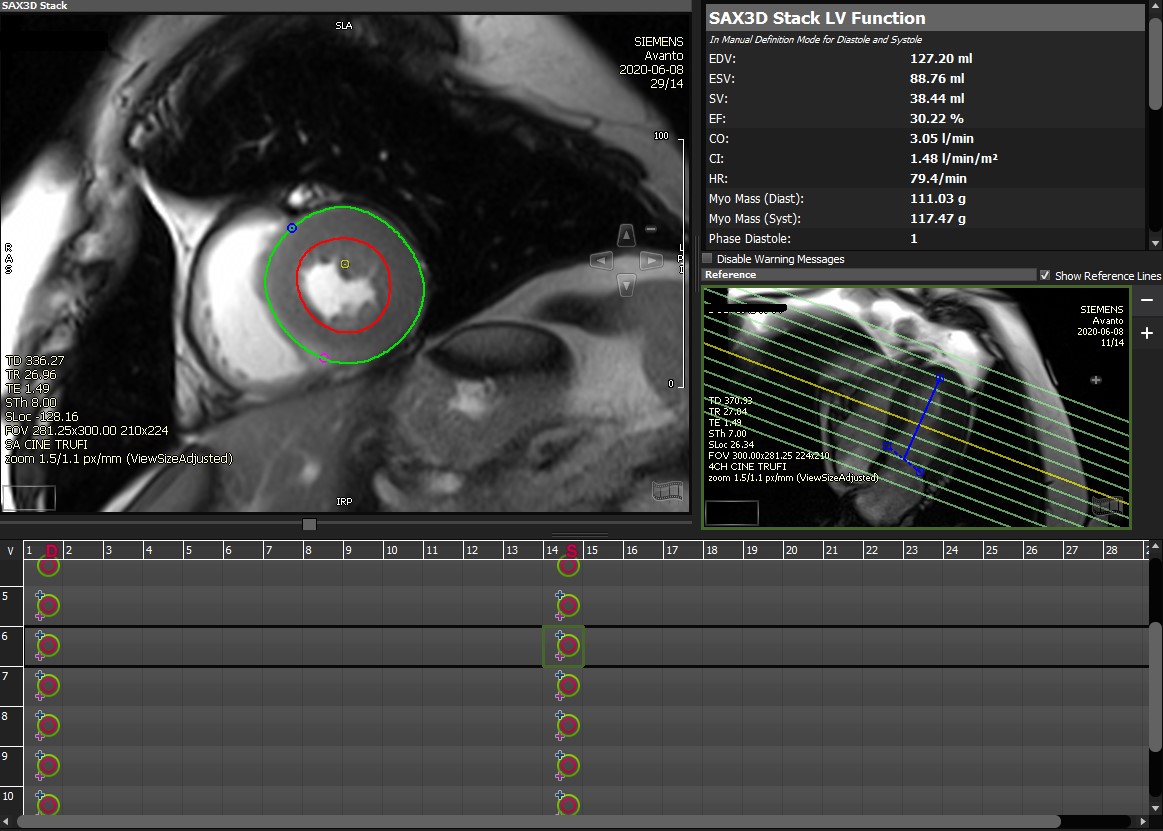
Quantification of ventricular function is performed using commercially available software (CVI42, Circle Cardiovascular Imaging Inc., Canada) with manual and AI assisted contouring of the left ventricular (LV) and right ventricular (RV) epicardial and endocardial borders in end-systole and end-diastole.
|
Illustrative cases
|
|
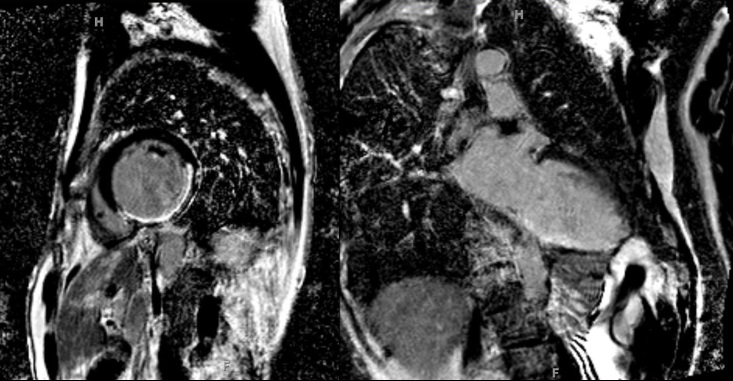
Case 1: Cardiac Sarcoidosis
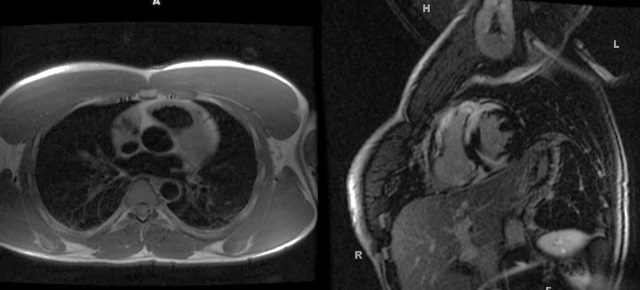
- Usually seen with other findings, e.g. pulmonary parenchymal disease (left dark blood image) or mediastinal lymphadenopathy
- Patchy, nodular delayed midmyocardial enhancment (right delayed enhancement SA image)
- DDX: cardiac amyloid, myocarditis
|
|
Case 2: Myocarditis
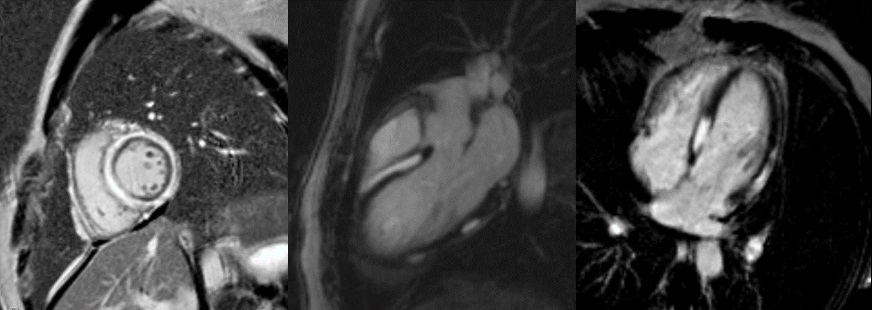
- Subepicardial delayed enhancement (on SA (left), LVOT, and HLA, delayed contrast enhanced images)
- Frequently involving the lateral wall
- Wall motion abnormalities in the affected regions
- Increased T2 signal (edema) can be seen in affected region
- Most common cause is viral infection
- Additional causes: drug toxicity, autoimmune disorders (e.g. Lupus) and mixed connective tissue diseases
|
|
Case 3: Inferior Myocardial Infarction
- Transmural delayed enhancement in the inferolateral wall seen on SA (left) and VLA (right) PSIR images
- If the enhancement involves more than 50% of the myocardial thickness = transmural
- Delayed Enhancement (DE) confined to a vascular territory
- Often there are wall motion abnormalities in region of DE
|
|
 KRISTIN PORTER, MD, PHD PAMELA JOHNSON, MD